Western Churchill NATMAP
ElectroMagnetic activities


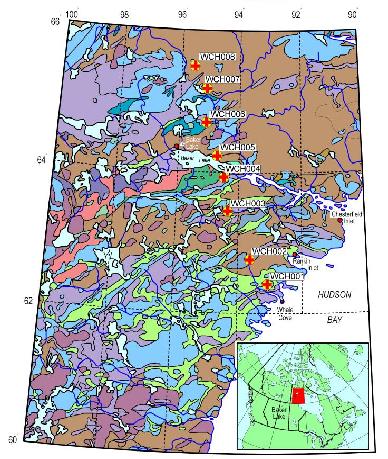
The principal objective of the western Churchill NATMAP program is to provide modern geological maps of late Archean greenstone belts in a part of the Canadian Shield with great mineral potential, but lacking an adequate geoscientific infrastructure. The maps will underpin an enhanced, multidisciplinary geoscience knowledge base of the scale and scope required to formulate a predictive framework for crustal growth, tectonic evolution and mineral potential, and the establishment of environmental baselines for the western Churchill Province. To that end, a set of integrated multidisciplinary objectives are proposed:
 Press on map for full sized image (243 Kb)
| WCH008
| 65:29:54 (65.4983)
| 95:33:17 (95.5547)
| 98-07-18 17:31:00
| 98-08-14 12:20:00
| WCH007
| 65:16:04 (65.2678)
| 95:07:41 (95.1280)
| 98-07-18 13:31:00
| 98-08-14 13:50:00
| WCH006
| 64:47:01 (64.7836)
| 95:02:58 (95.0494)
| 98-07-17 17:00:00
| 98-08-14 15:35:00
| WCH005
| 64:13:18 (64.2217)
| 94:48:38 (94.8106)
| 98-07-14 20:16:00
| 98-08-14 17:03:00
| WCH004
| 63:55:42 (63.9283)
| 94:29:18 (94.4883)
| 98-08-15 19:24:00
| 98-09-17 00:53:00
| WCH003
| 63:27:13 (63.4536)
| 94:20:54 (94.3483)
| 98-08-16 00:31:00
| 98-09-15 05:33:00
| WCH002
| 62:46:01 (62.7669)
| 93:37:53 (93.6314)
| 98-08-18 18:01:00
| 98-09-18 15:22:00
| WCH001
| 62:26:18 (62.4383)
| 93:03:23 (93.0564)
| 98-08-18 21:01:00
| 98-09-18 18:23:00
| |
K indices isolate solar particle effects on the Earth's magnetic field; over a
3-hour period, they classify into disturbance levels the range of variation of
the more unsettled horizontal field component. Each activity level relates
almost logarithmically to its corresponding disturbance amplitude. Three-hour
indices discriminate conservatively between true magnetic field perturbations
and the quiet-day variations produced by ionospheric currents.
K indices range in 28 steps from 0 (quiet) to 9 (greatly disturbed) with
fractional parts expressed in thirds of a unit. The arithmetic mean of the K
values scaled at 13 observatories worldwide (including Ottawa and
Meanook) gives Kp.
The histogram of the Kp indices for the interval shows the predominance of values in the range 1-2, and the cumulative histogram shows that half of the data has a Kp index less than 2, 75% less than 3, and almost 90% less than 4. Thus, by discarding 10% of the data we will avoid very strong non-uniform source field effects, and discarding 25% of the data will avoid most non-uniform effects.
Inspecting the Kp indices, there is an interval 69 hours long when the Kp is greater than 3.0, and that is 98-08-26 06:00 - 98-08-29 03:00. The longest interval with Kp equal or less than 2.0 (apart from a short interval) is the 96 hours between 98-09-03 18:00 - 98-09-07 18:00.
The reason that magnetic activity is so important, especially for this survey, is that highly active times may give erroneous MT response functions that will lead to erroneous conclusions about the Earth below. For a theoretical example of this problem, read the abstract from the 1998 SNORCLE transect meeting by Cassels and Jones (1998), and the published paper by Garcia et al. (1997).
A comparison of the MT response functions computed using just the data at WCH004 (without "remote-reference" processing), and in geographic coordinates, for the quite (98-09-03 18:00 - 98-09-07 18:00) and active (98-08-26 06:00 - 98-08-29 03:00) time periods is shown here. The solid symbols are for the quiet period, and the open symbols are for the active period. Note the higher phases for the active period, especially in the range 100 - 1000 seconds, and the lower estimates of apparent resistivity. These are generally as predicted in the theoretical studies given above. (Note: the wavelength of the extenal source fields is period dependent, so the effects on the MT responses will not exhibit the simple form shown in Cassels and Jones, 1998).
One can look at the Hz data in more detail, and especially for quiet days when the source contribution should be small. The Hz data from the southern four sites for day 98-09-10 show a remarkably uniform vertical field across the whole length of the profile. Even at the smaller scale of one hour (98-09-10 18:00-19:00 UT) one sees little difference along the profile. Going to an even smaller time scale of 5 minutes (98-09-10 18:10-18:15 UT) there is now visible differences, with increased amplitudes in the sinusoids with about 30 seconds periodicity, centred at 11 minutes and 13 minutes, for the southernmost site (WCH001) and the site south of Baker Lake (WCH004). The increase in amplitude at WCH001 is likely caused by the coast effect - an increase in magnetic fields caused by currents that flow in the sea water close to the coast. The increase in amplitude at site WCH004 is caused by an anomaly in conductivity beneath, or to the north of, site WCH004. That the increased amplitude is most apparent at the higher frequencies indicates that the anomaly is shallow, probably in the crust.
Inspecting the data from the northern stations in the same manner, the quietest day magnetically is 98-08-02, and the vertical field variations are all very similar along the whole profile. Picking out a two hour very quiet interval, when the source fields should be most uniform, 98-08-02 05:00-07:00 UT shows an increasing amplitude to the north, which is likely a residual effect due to the source fields. An afternoon hour, 98-08-02 19:00-20:00 UT, which is 3 PM local geographic time and about 1:30 PM local geomagnetic time, shows the uniformity across the whole profile.
There is very little large-scale conductive structures in the region visible in the time series.
 MTNet Home Page
 Alan's Home Page
 alan-at-cp.dias.ie
